A heatmap is a graphical representation of data that uses a system of color-coding to represent different values. Heatmaps are used in various forms of analytics but are most commonly used to show user behavior on specific web pages or webpages templates. Heatmaps can be used to show where users have clicked on a page, how far they have scrolled down a page, or used to display the results of eye-tracking tests.
Analytics tools like Google Analytics or Site Catalyst are great at providing metrics to show which pages users visit but they can lack detail when it comes to understanding how users engage with those pages. Heatmaps can give a more comprehensive overview of how users are really behaving. Heatmaps are also a lot more visual than standard analytics reports, which can make them easier to analyze at a glance. This makes them more accessible, particularly to people who are not accustomed to analyzing large amounts of data. Good heatmapping tools, such as CrazyEgg and ClickTale, enable analysts to segment and filter the data. This means that it can be easy to see how different types of users are engaging with a particular page.
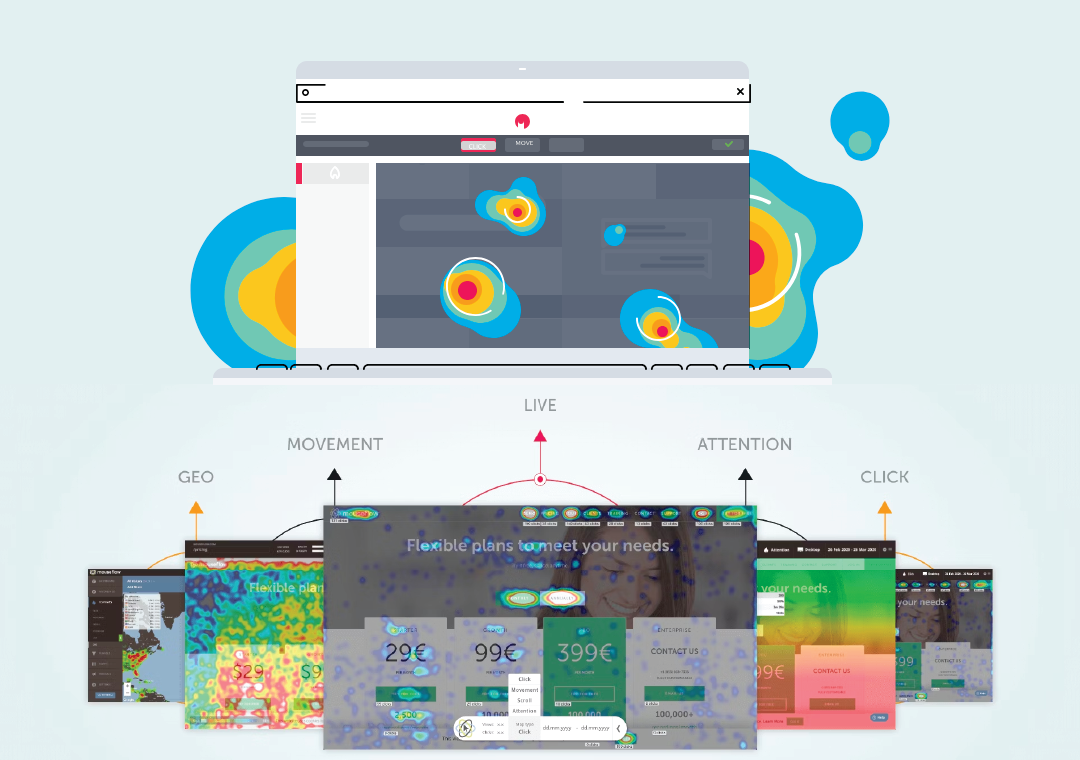
Mouse tracking heat maps are a popular conversion optimization tool, but what good are they really? It’s easy to say that they help you to see what users are doing on your site. Sure, of course – but lots of other methods do that too, and perhaps with greater accuracy. Basically, they allow us to record what people do with their mouse or trackpad and quantify it, and then they display it in a way that is visually appealing.
Hover Maps (Mouse Movement Tracking)
When people say ‘heatmap’, they often mean hover map. It shows you areas where people have hovered over with their mouse cursor. The idea is that people look where they hover and thus it shows how users read a web page. Hover maps are modeled off of a classical usability testing technique: eye tracking. While eye tracking is useful in understanding how a user navigates a site, mouse tracking tends to fall short because of some stretched inferences.
Click Maps
Click maps show you a heatmap comprised of aggregated click data. Blue is fewer clicks, and when it gets towards the warmer reds there are more clicks, and the most clicks are the brightest white and yellow spots. This is pretty cool to look at and to be clear, there’s a lot of communicative value in these maps. They help explain across teams the importance of optimization and what is and isn’t working. Got a big photo that takes up a lot of the page that lots of people click on but isn’t a link? Maybe make it a link or something.
Attention Maps
An attention map is a heatmap that shows you which areas of the page are viewed the most by the user’s browser with full consideration of the horizontal and vertical scrolling activity. They show which areas of the page have been viewed the most, taking into account how far they scroll, and how long they spend on the page.